
Responsive, Performant Images for the Web
Learn to optimize your images for the web in this video from PerfMatters Conf.
Strategic web performance tips that you should be focusing on in 2025 to improve Core Web Vitals

What should you be worried about when it comes to web performance in 2025? How should you even start?
I'm a web performance engineer, and I see a lot of common mistakes across the board when web developers and website owners try to understand and fix web performance, or "Core Web Vitals" in popular parlance.
This post started as a Valentines-themed social media thread to celebrate a follower milestone. I decided to write up these short and sweet nuggets (or nougats? 🍫) of web performance knowledge in case you missed it:
My #1 tip is to know your weaknesses before you start "fixing" things. Most people still reach for Lighthouse first and churn on low value fixes, wasting time and generating frustration.
Instead, look at real user data (or field data) first to find your weaknesses. The Chrome User Experience Report (CrUX) is a great start.
Here are three CrUX tools I reach for the most:
Analyze your data to see which metrics fail on which pages and devices. Then focus your debugging on those specific issues.
CrUX won't give you detailed breakdowns nor connect with key business metrics like bounce rate and conversion rate. So, you'll eventually want to graduate to a full-featured solution. You can roll your own with web-vitals or use a RUM provider like SpeedCurve, DebugBear and RUMvision to name a few.
Once you know where you're failing with RUM, make sure you understand the metrics and the common reasons why they fail. So that you can be more strategic about approaching optimization.
Largest Contentful Paint (LCP) measures loading speed, specifically when the largest item in the viewport has rendered.
LCP is currently the hardest metric to achieve "good" across the web.
We can make it easier by breaking it down into metrics that represent each part, further reducing the total possible causes for poor perf. This means less time and frustration debugging in lab tools.
If your RUM supports LCP sub-parts, here are two great articles to guide you:
If your RUM does not support LCP sub-parts, you can use TTFB and FCP in a similar way, which I describe in this article: Debugging common causes for slow loading. It's focused on Shopify sites, but the concepts are the same for all sites. And, a lot of the common causes are shared across e-commerce & the web.
Today I will make enemies. My third tip is that images are usually a micro-optimization. Usually, your time would be more wisely spent on other issues.
Images are the most popular thing to optimize when it comes to web performance. My guess as to why?
Unpopular opinion: Once you've done a modicum of basic image size optimization (e.g., not serving 1MB+ images), your problems are probably more likely to be loading priorities, order, the critical rendering path, and render-blocking resources.
While unpopular, my opinion is backed by data:
The majority of origins with poor LCP spend less than 10% of their p75 LCP time downloading the LCP image."
–Brendan Kenny from Common misconceptions about how to optimize LCP
My advice: stop spending so much time micro-optimizing your image sizes, and instead dig into your RUM data to figure out where the real culprits may be, and debug.
Switching gears from loading speed, if your site is failing Cumulative Layout Shift (CLS), luckily it is usually due to a smaller set of possible reasons.
CLS measures unexpected layout shifts which frustrate users. Think about the last time you tried to follow a recipe online and the content kept jumping around as more ads were injected.
I cover common causes and how to debug them in this post, How to optimize Cumulative Layout Shift (CLS) on Shopify sites. It's focused on Shopify but can be applied to most of the web.

Interaction to Next Paint (INP) measures how long before the next paint after a user interaction. Poor INP results in rage clicks and page abandonment.
INP requires user interaction so it is a field-only metric. As such, RUM data is critical for both INP and LoAF (long animation frames) otherwise you're just guessing and rooting around in the dark.
You can start by cleaning up your JS (reducing third parties and dependencies, etc.), but if that's not enough, you'll need to start detailed RUM to catch your worst offenders. See options and recommended providers in 1. Know your weaknesses
An ounce of prevention is worth a pound of cure. When deciding on architecture, make sure you keep UX and web perf top of mind. Folks often reach for tools like JS frameworks when they aren't needed, will add extra bloat, and result in higher development costs.
Harry Roberts has a great post about this and using the web platform, Build for the Web, Build on the Web, Build with the Web.
On the prevention front, know the platform. If you're a JavaScript dev, shore up your skills in HTML and CSS. Know what the platform can do for you. These two videos by Ryan Townsend and Kilian Valkhof are excellent starts:
On prevention again, use CrUX data to help you decide between frameworks, platforms, and themes - The CWV Tech Report is a great tool for this.
For example, I used CrUX data to analyze whether headless ecommerce was all it was cracked up to be in Liquid vs headless: A look at real user web performance (short answer: no).
You can also dig deeper into the data for more specialized analysis, which is how I built Theme Vitals - a tool for comparing performance of Shopify themes. CrUX and HTTP Archive are public data sets - use them to answer key questions before you pick a bad framework or tool.
If you're an engineer who wants to get better at performance, start following the experts! Here's a list of experts and accounts that create web performance content that I compiled into a Bluesky starter pack.

Once you've fixed your performance, if you're large enough and have a budget, invest in a performance culture. SpeedCurve has a great guide around this: Best Practices for Creating a Culture of Web Performance.
In my experience and contrary to what a lot of folks in my space might talk about, most companies are too small to dedicate staff toward this. There is a middle ground though!
Performance culture for small companies:
Take care of yourself by asking for help. Front end development is not easy. Nowadays, developers need to know too much in too many wheelhouses - from core HTML, CSS, and JS coding to frameworks, accessibility, SEO, and web perf.
Is it really better to have your devs churn 100 hours with no results than just hire a web perf expert who can give you results in a tenth of the time? I'm here to help along with other web perf freelancers. Check out my services or contact me today to get started.
Contracting a web perf expert is a smart decision for many companies of all sizes. However, buyer beware! A lot of scam apps, third parties, and contractors are out there.
General tip: if it sounds too good to be true, then it's probably a scam or hack...
Your app might be cheating Lighthouse scores or your freelancer might be regurgitating Lighthouse audits or doing busy work like micro-optimizing images. The latter can be a problem as undersized images can reduce conversion rates on ecommerce sites (poor-quality images = poor-quality products by consumers).
My former colleague wrote a great piece about this when he went through the Shopify app store to clean up a lot of problematic apps: Don’t get scammed by fake performance experts and apps.
As we approach the end of this series, let's circle back to why performance is important. We know little to nothing about how Google changes rank based on performance, but one thing we've proven repeatedly is that poor performance results in higher bounces and lower conversions.
You can check out multiple case studies on WPO stats as use them in your message to managers and business leaders.
But, your message will be even better if...
In the following photo, you can see aggregated data collected across multiple ecommerce sites in the showing how Largest Contentful Paint, a loading speed metric, impacts both conversions and bounces:
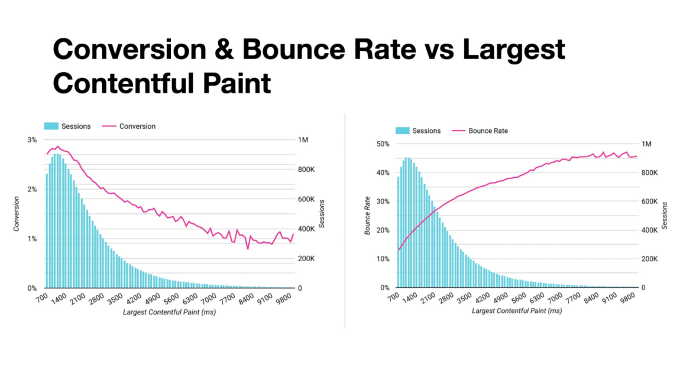
By leveraging real user data paired with your business's key performance metrics, you can:
Now, go forth and optimize!
I make websites faster, smarter, and easier to grow.
If you want someone who’s creative and precise, deeply reliable, and not afraid to tell you what’s what to get you to the next level—I’m your partner.
Learn to optimize your images for the web in this video from PerfMatters Conf.

Trying to convince your company to make site load speed improvements? Maybe Google Analytics can help.

A smarter way to break down loading speed problems, identify causes, and implement optimizations
If you liked this article and think others should read it, please share it.
 4
4
These are webmentions via the IndieWeb and webmention.io. Mention this post from your site: